Flexure-Hinge Torque-Sensor Study — Increasing Moment Capacity of 6-DoF FT Sensors
Lightweight flexure stage increases 6-DoF sensor moment capacity to ≥280 Nm while preserving 1 N force resolution. Analytical, numerical and experimental investigation of crossed-strip flexure pivots to decouple force and moment limits in 6-DoF force-torque sensors. Conducted at TUM-MIRMI under supervision of Mehmet Can Yıldırım and Prof. Sami Haddadin.
1 · Overview & Motivation
Problem statement — How can we extend a compact 6-DoF force-torque sensor’s tilting-moment limit from 160 Nm to ≥ 280 Nm without degrading sub-newton force resolution?
The study was conducted at TUM-MIRMI (Chair of Robotics & AI, Prof. Sami Haddadin) during a three-month Forschungspraxis, supervised by Mehmet Can Yıldırım.
Market Analysis & Problem Context
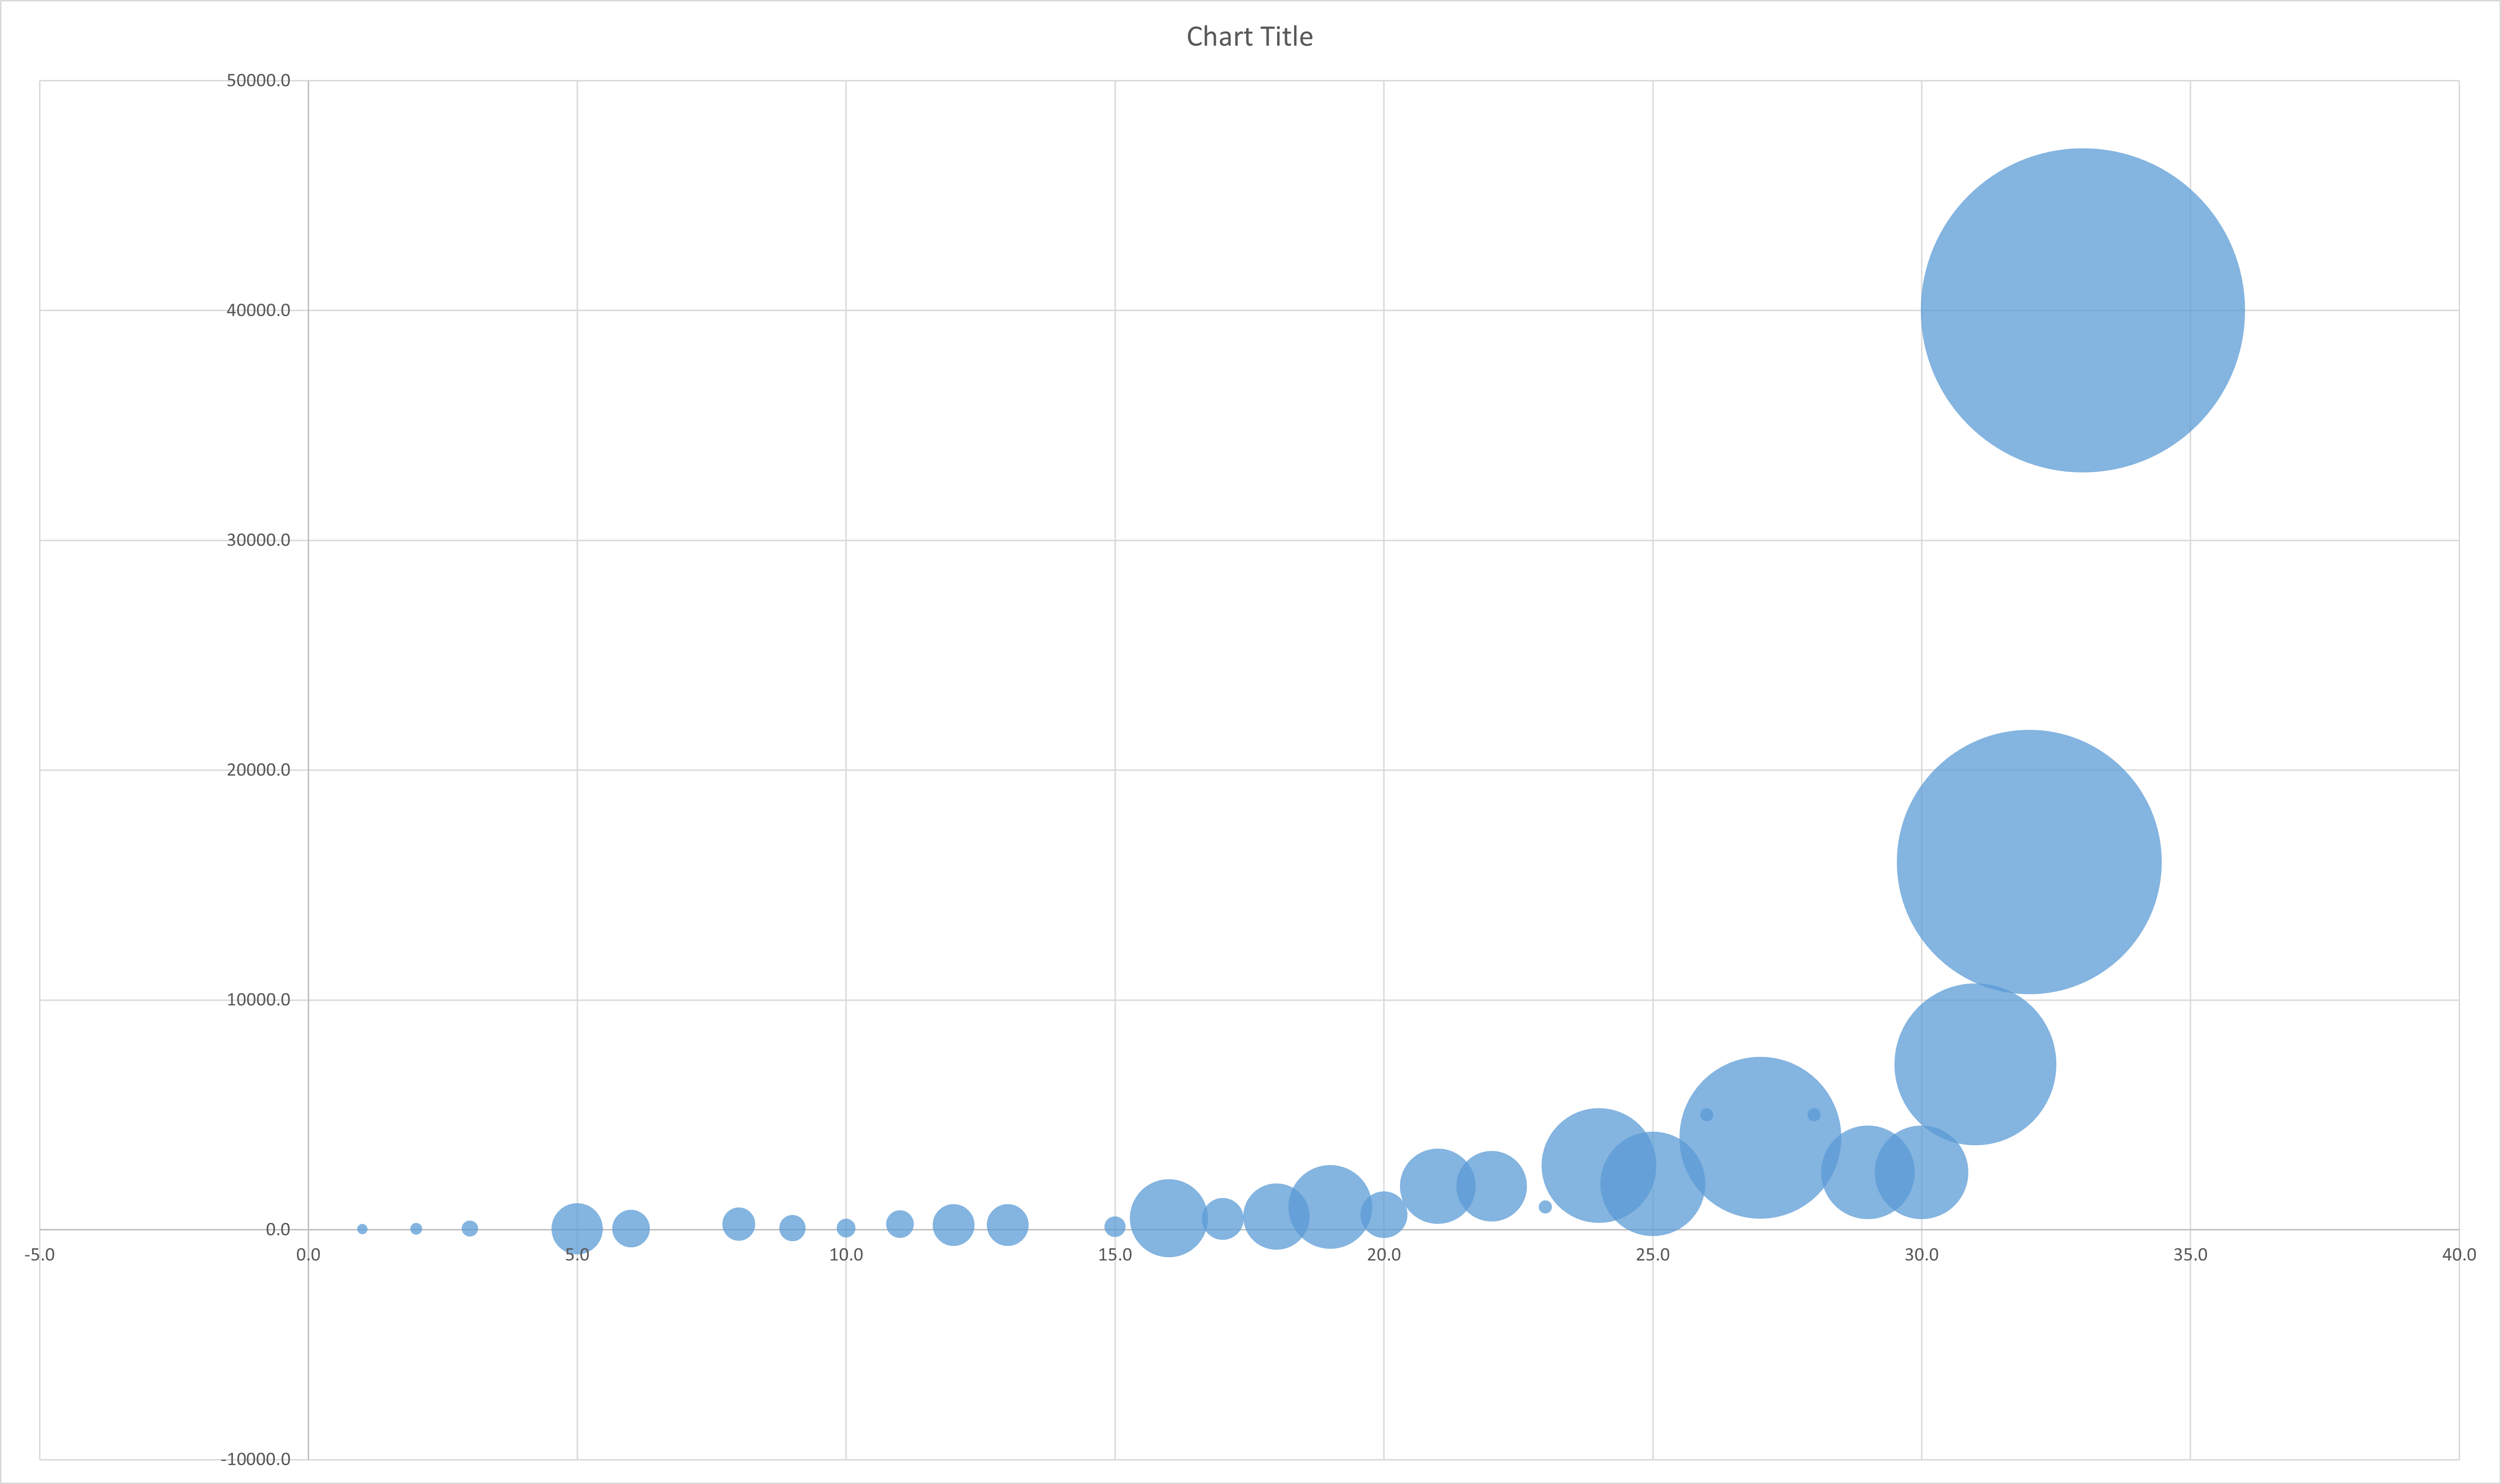
Commercial 6-DoF FT sensors exhibit exponential force–moment scaling: achieving higher moment capacity typically requires increased force capacity, resulting in oversized sensors with reduced sensitivity. This presents challenges for applications demanding high moment handling coupled with precise force measurement.
Critical Robot Examples:
- Franka Emika Panda: Generates up to 280 Nm tilting torque, and up to 190 Nm rotational torque
- ABB YuMi: Handles ±101 Nm (X-axis), momentarily peaks at ±202 Nm during emergency stops
- Current sensor technology struggles to simultaneously manage these large moments while preserving force-measurement precision.
Our approach introduces a crossed-flexure hinge stage designed to mechanically redirect excessive tilting moments, thus safeguarding the sensor’s axial-force measurement fidelity.
| Why this matters |
|---|
| Decouples force and moment scaling—maintains 1 N force resolution at ≥ 280 Nm. |
| Monolithic, backlash-free, zero maintenance. |
| Analytical + experimental loop produces designs rapidly (< 10 ms/solve). |
| Drop-in integration ahead of the FTE-Omega-160-IP60 SI-1000-120 sensor on a Franka Panda arm. |
2 · Analytical Model — Crossed-Strip Theory
2.1 Theoretical Foundation
The analytical modeling of crossed-flexure hinges is rooted in Wittrick’s crossed flexure pivot theory and further refined by Gunnink’s optimal geometry research. Flexural pivots are mechanical components known for their exceptional compliance in the rotational direction (θ), coupled with high stiffness in all other degrees of freedom. They commonly feature a symmetrical arrangement with two identical leaf springs intersecting at their midpoints. For stability and optimal stiffness, an intersection angle of 2α = π/2 (90°) is often adopted.
Material Properties & Specifications:
- Young’s Modulus (E): 200 GPa (spring steel)
- Moment of Inertia (I): $I = \frac{b t^3}{12} = \frac{13 \times (0.5)^3}{12} = 0.1354 \; \text{mm}^4$
- Convergence Criteria: Tolerance = $10^{-6}$, maximum iterations = 100,000
- Reference Loads & Angles: $V = 100 \; \text{N}, \quad H = 100 \; \text{N}, \quad α = 45^\circ, \quad θ = 30^\circ$
2.2 Crossed-Strip Geometry
Two identical leaf springs (length L = 98 mm, width b = 13 mm, thickness t = 0.5 mm) intersect at angle α, establishing a virtual pivot enabling a target rotation of θ ≈ 30°.
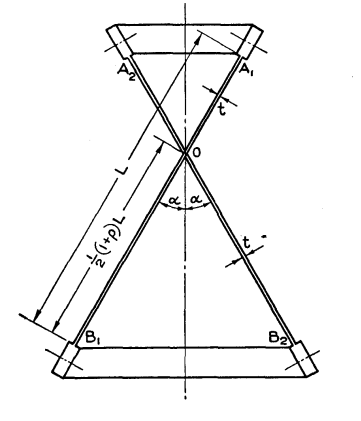
Figure 2.1 — Front view showing crossed-strip geometry with angle α
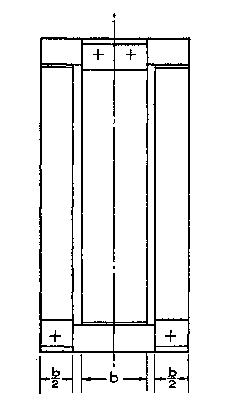
Figure 2.2 — Side view with applied loads H, V and rotation θ
2.3 Dimensionless Formulation
To simplify analysis and ensure generality independent of absolute dimensions, the crossed-strip equations are represented in a dimensionless form:
\[h=\frac{H L^{2}}{EI}\csc\alpha,\quad v=\frac{V L^{2}}{EI}\sec\alpha,\quad \xi=\frac{2\delta}{\theta L}-1,\quad \lambda=\frac{1}{4}\left(3-\coth^{2}\beta+\frac{\coth\beta}{\beta}+4\xi\right)\]The equilibrium conditions lead to two coupled nonlinear residual equations with the dimensionless stiffness parameters β₁, β₂, solved using iterative numerical methods.
2.4 Newton–Raphson Numerical Solver
The Newton-Raphson method iteratively solves the system of nonlinear equations, quickly converging (< 10 ms per solution) using finite-difference approximations of the Jacobian:
[β1, β2] = newton_raphson(@equations, β1_0, β2_0, θ, h, v);
Outputs from the solver provide essential parameters (e.g., ξ, λ) used to compute practical metrics such as center-drift displacements and hinge deformation profiles.
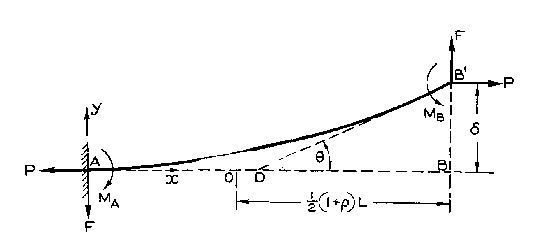
Analytical bending of a single strip
3 · MATLAB Simulation Pipeline
To comprehensively analyze hinge performance, a MATLAB-based simulation pipeline was developed, enabling rapid exploration of geometric configurations and load scenarios.
| Simulation Step | Purpose | Runtime |
|---|---|---|
| Input Initialization | Define geometry and loading parameters (E, L, b, t, α, θ, H, V, δ/e) | — |
| β-Solution | Newton–Raphson solver for stiffness parameters β₁, β₂ | < 10 ms |
| Back-substitution | Compute dimensionless parameters ξ, λ and displacements (dx, dy) | 2 ms |
| Profile Generation | Generate parabolic deformation profile for each leaf spring | 1 ms |
| Export & Visualization | Output results, coefficients, and deformation plots | 5 ms |
The full 200 × 200 parameter sweeps are executed efficiently in approximately 8 seconds on modern computing hardware.
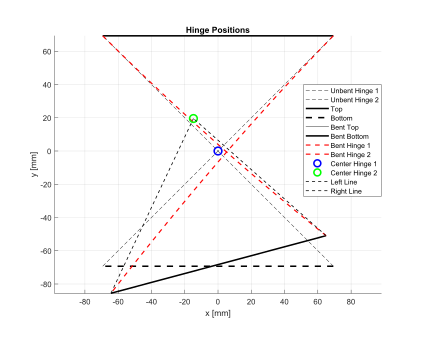
Simulated profile at θ = 30°
4 · CAD & Prototype Fabrication
4.1 Design Evolution & Iterative Refinements
The crossed-flexure hinge was iteratively designed and optimized through multiple CAD iterations in SolidWorks, emphasizing ease of assembly, reliable strain gauge installation, and precise mechanical performance. Early prototypes addressed issues such as strain gauge positioning, clamp interference, and optimal bolt preload to ensure accurate and repeatable measurements.
Key design improvements during iterations:
- Strain Gauge Accessibility: Incorporated pockets to facilitate strain gauge installation without compromising structural integrity.
- Clamp Geometry: Fine-tuned tolerances for the PLA clamps to ensure uniform preload distribution on the spring-steel strips.
- Bolt Pattern Optimization: Arranged M3 bolts to guarantee consistent clamping force, mitigating potential slip or uneven stress distribution during tests.
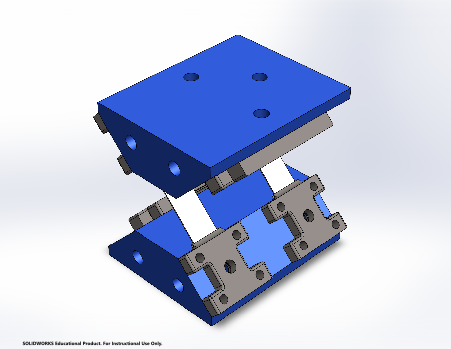
Figure 4.1 — Complete CAD assembly with mounting interface
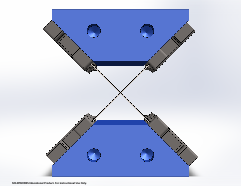
Figure 4.2 — Front view showing M3 bolt pattern and strain gauge access
4.2 Manufacturing & Assembly Specifications
Prototypes were manufactured to validate theoretical predictions and to facilitate experimental testing:
- Material Selection: 0.5 mm spring-steel leaf strips chosen for high elastic limit and repeatable deformation characteristics, clamped using robust PLA blocks to secure the strips precisely.
- Bolt Preloading: Each clamp secured with M3 bolts torqued precisely to 14 Nm to ensure consistent preload and eliminate slip-induced measurement errors.
- Surface Preparation for Gauges: Prior to strain gauge installation, leaf surfaces underwent meticulous sanding (400-grit) and isopropyl alcohol cleaning to ensure optimal adhesion and measurement fidelity.
- Adhesive Protocol: Utilized precise MBond 200 adhesive mixing ratios and curing conditions (3 min at 50°C) to guarantee uniform bond strength and long-term sensor reliability.
- Mass & Stiffness Optimization: Final prototype mass measured at 126 g including hardware, offering an optimized stiffness ratio $k_M/k_F ≈ 4.3\; \mathrm{Nm}^{-1}$, beneficially elevating moment range while maintaining negligible axial force noise.
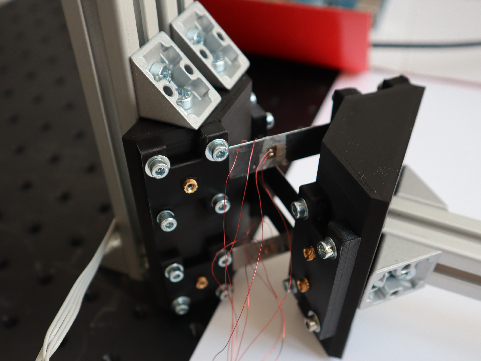
Final prototype with Strain Gauges
The steel adapter plate securely mates the flexure stage to the commercial FTE-Omega-160-IP60 SI-1000-120 sensor, providing a robust, modular solution readily integrated into the Panda-Base Digital Twin for comprehensive evaluation.
5 · Computer-Vision Validation
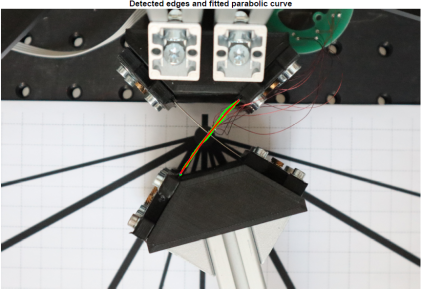
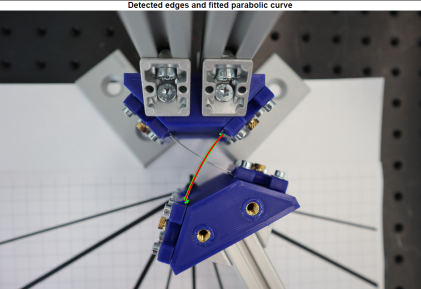
To validate the accuracy of analytical deformation models, a robust computer-vision pipeline was established. High-resolution DSLR images were captured at prescribed hinge rotations (15° and 30°) and systematically analyzed to extract deformation profiles. The measured curvature was then rigorously compared against analytical predictions.
5.1 Image Acquisition & Preprocessing Pipeline
The validation pipeline consisted of multiple processing steps ensuring reliable and repeatable results:
- ROI Selection: A region-of-interest around one leaf spring was interactively defined by the operator.
- Image Pre-processing: Converting RGB to grayscale, followed by median filtering (3×3 kernel), contrast enhancement via adaptive histogram equalization (CLAHE), and morphological operations (open-close) to accentuate edge features.
- Edge Detection (Canny Method): Edge extraction with carefully tuned adaptive thresholds (low threshold 0.1, high threshold 0.3) to ensure stable detection across diverse lighting conditions.
- Parabolic Curve Fitting (RANSAC): Robust fitting of the detected edges using a second-order polynomial ($y = ax^2 + bx + c$) via the RANSAC algorithm. The inlier threshold was set to 5 pixels, ensuring resistance against outliers and noise.
- Quantitative Metrics: Bend angles computed directly from the fitted parabolic slopes at leaf mid-span, accompanied by RMS error between fitted curves and original inlier points.
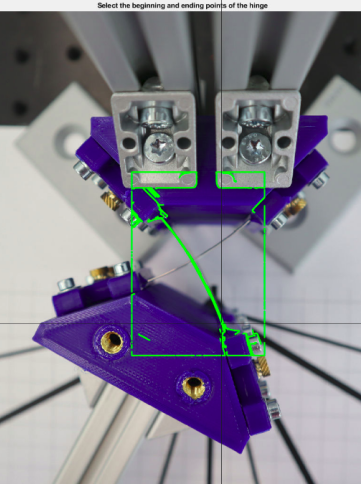
ROI → Canny → RANSAC pipeline
5.2 Validation Results & Analysis
Validation was executed at two benchmark angles:
| Test Condition | Analytical Angle (°) | Measured Angle (°) | Angle Difference (°) | RMS Curve Error (mm) |
|---|---|---|---|---|
| 15° Rotation | 14.8 | 15.9 | 1.1 | 0.33 |
| 30° Rotation | 30.3 | 32.1 | 1.8 | 0.37 |


Computer vision validation results: 15° and 30° bend analysis
The experimental validation demonstrated exceptional correlation between the analytical model and real-world deformation, consistently maintaining errors under 2° in angle and 0.4 mm in curvature shape. These findings substantiate the robustness and accuracy of the analytical crossed-flexure hinge model for high-precision robotic sensing applications.
6 · Strain-Gauge Instrumentation
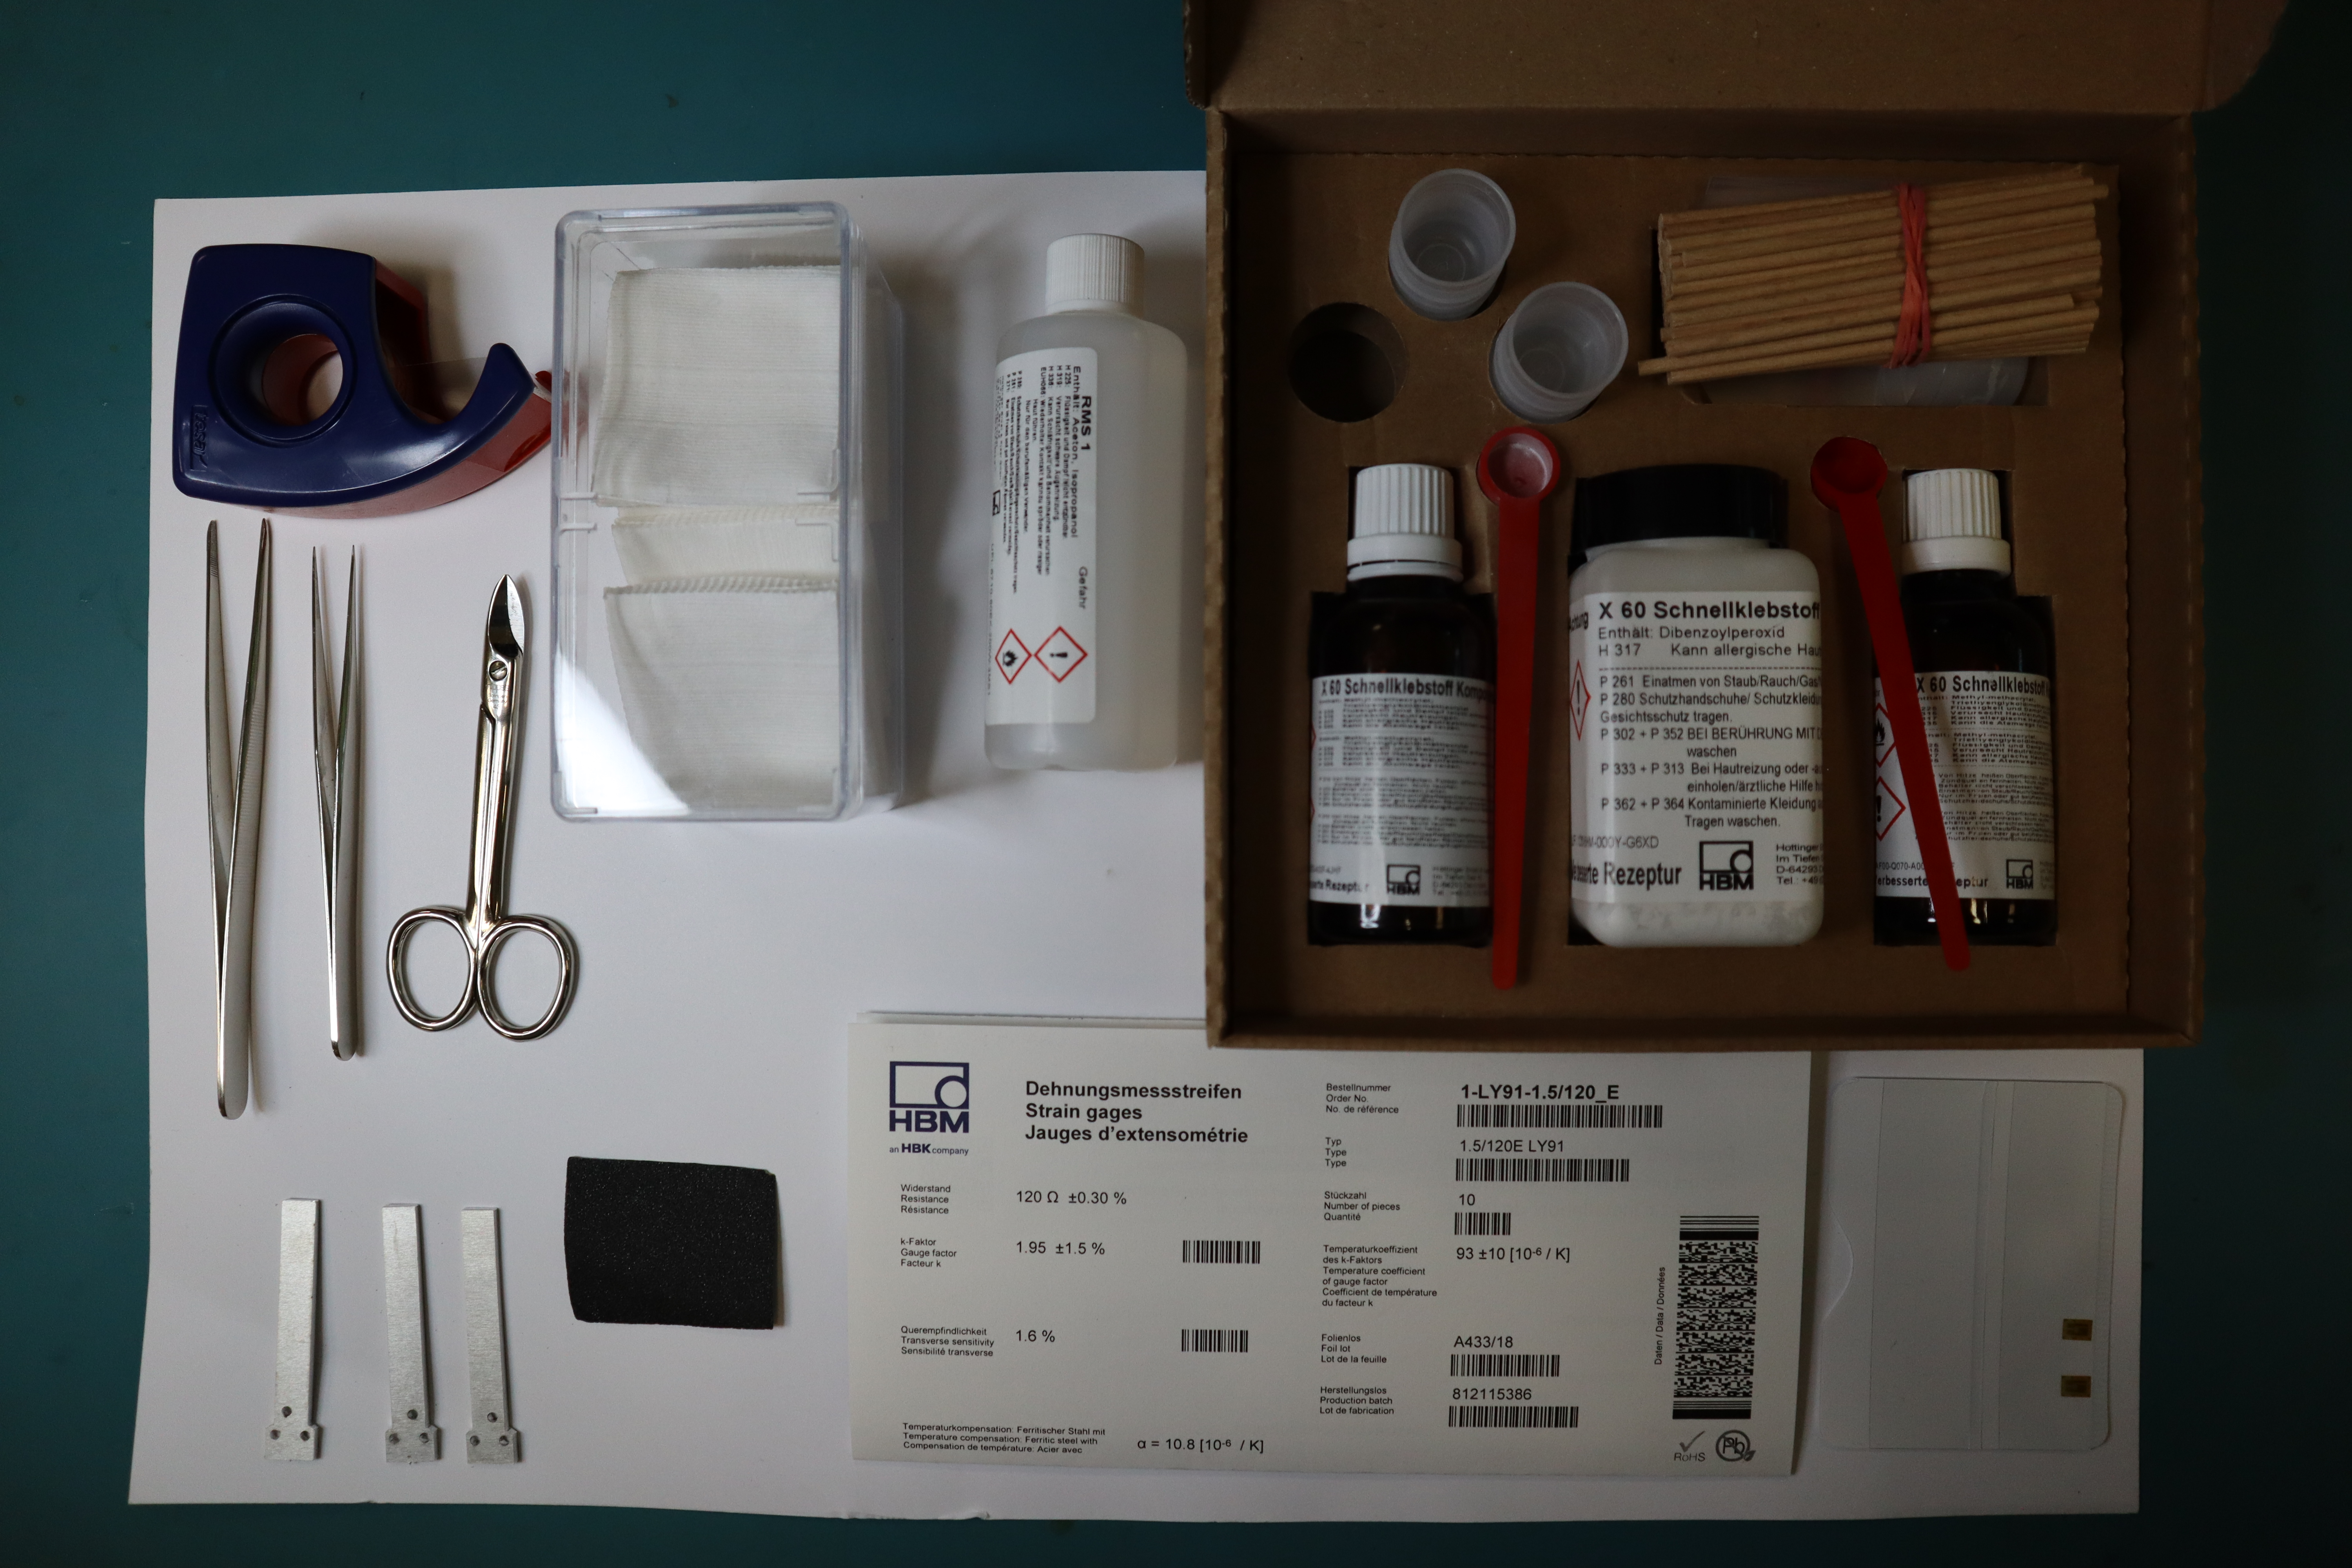
To experimentally measure stress distribution within the flexure hinges, we instrumented the lower leaf spring with precision strain-gauge sensors. Four HBK 350 Ω foil strain gauges were arranged in a full Wheatstone bridge configuration—two gauges positioned in tension regions and two in compression—to maximize measurement sensitivity and provide robust compensation for temperature-induced drift and external interference.
Key Specifications and Procedures:
- Bridge Configuration: Full Wheatstone bridge; symmetric placement about the leaf midpoint ensures maximum bending sensitivity and reliable stress detection.
-
Bonding Process:
- Surface Preparation: Sequential sanding at 400 → 800 → 1200-grit to achieve a smooth surface; cleaned meticulously with isopropyl alcohol to eliminate contaminants.
- Adhesive Application: Precisely mixed M-Bond 200 adhesive (resin-to-catalyst ratio of 100:10 wt %) applied uniformly under gauges.
- Clamping & Curing: Gauges aligned precisely to the leaf centerline (±0.2 mm tolerance), clamped uniformly at 80 kPa pressure, cured initially at 50 °C for 3 minutes, followed by room temperature stabilization for 1 hour.
- Wiring & Protection: Strain gauges connected using twisted, colour-coded lead wires carefully routed through dedicated slots in PLA clamps; silicone strain-relief application prevented accidental stress on wires.
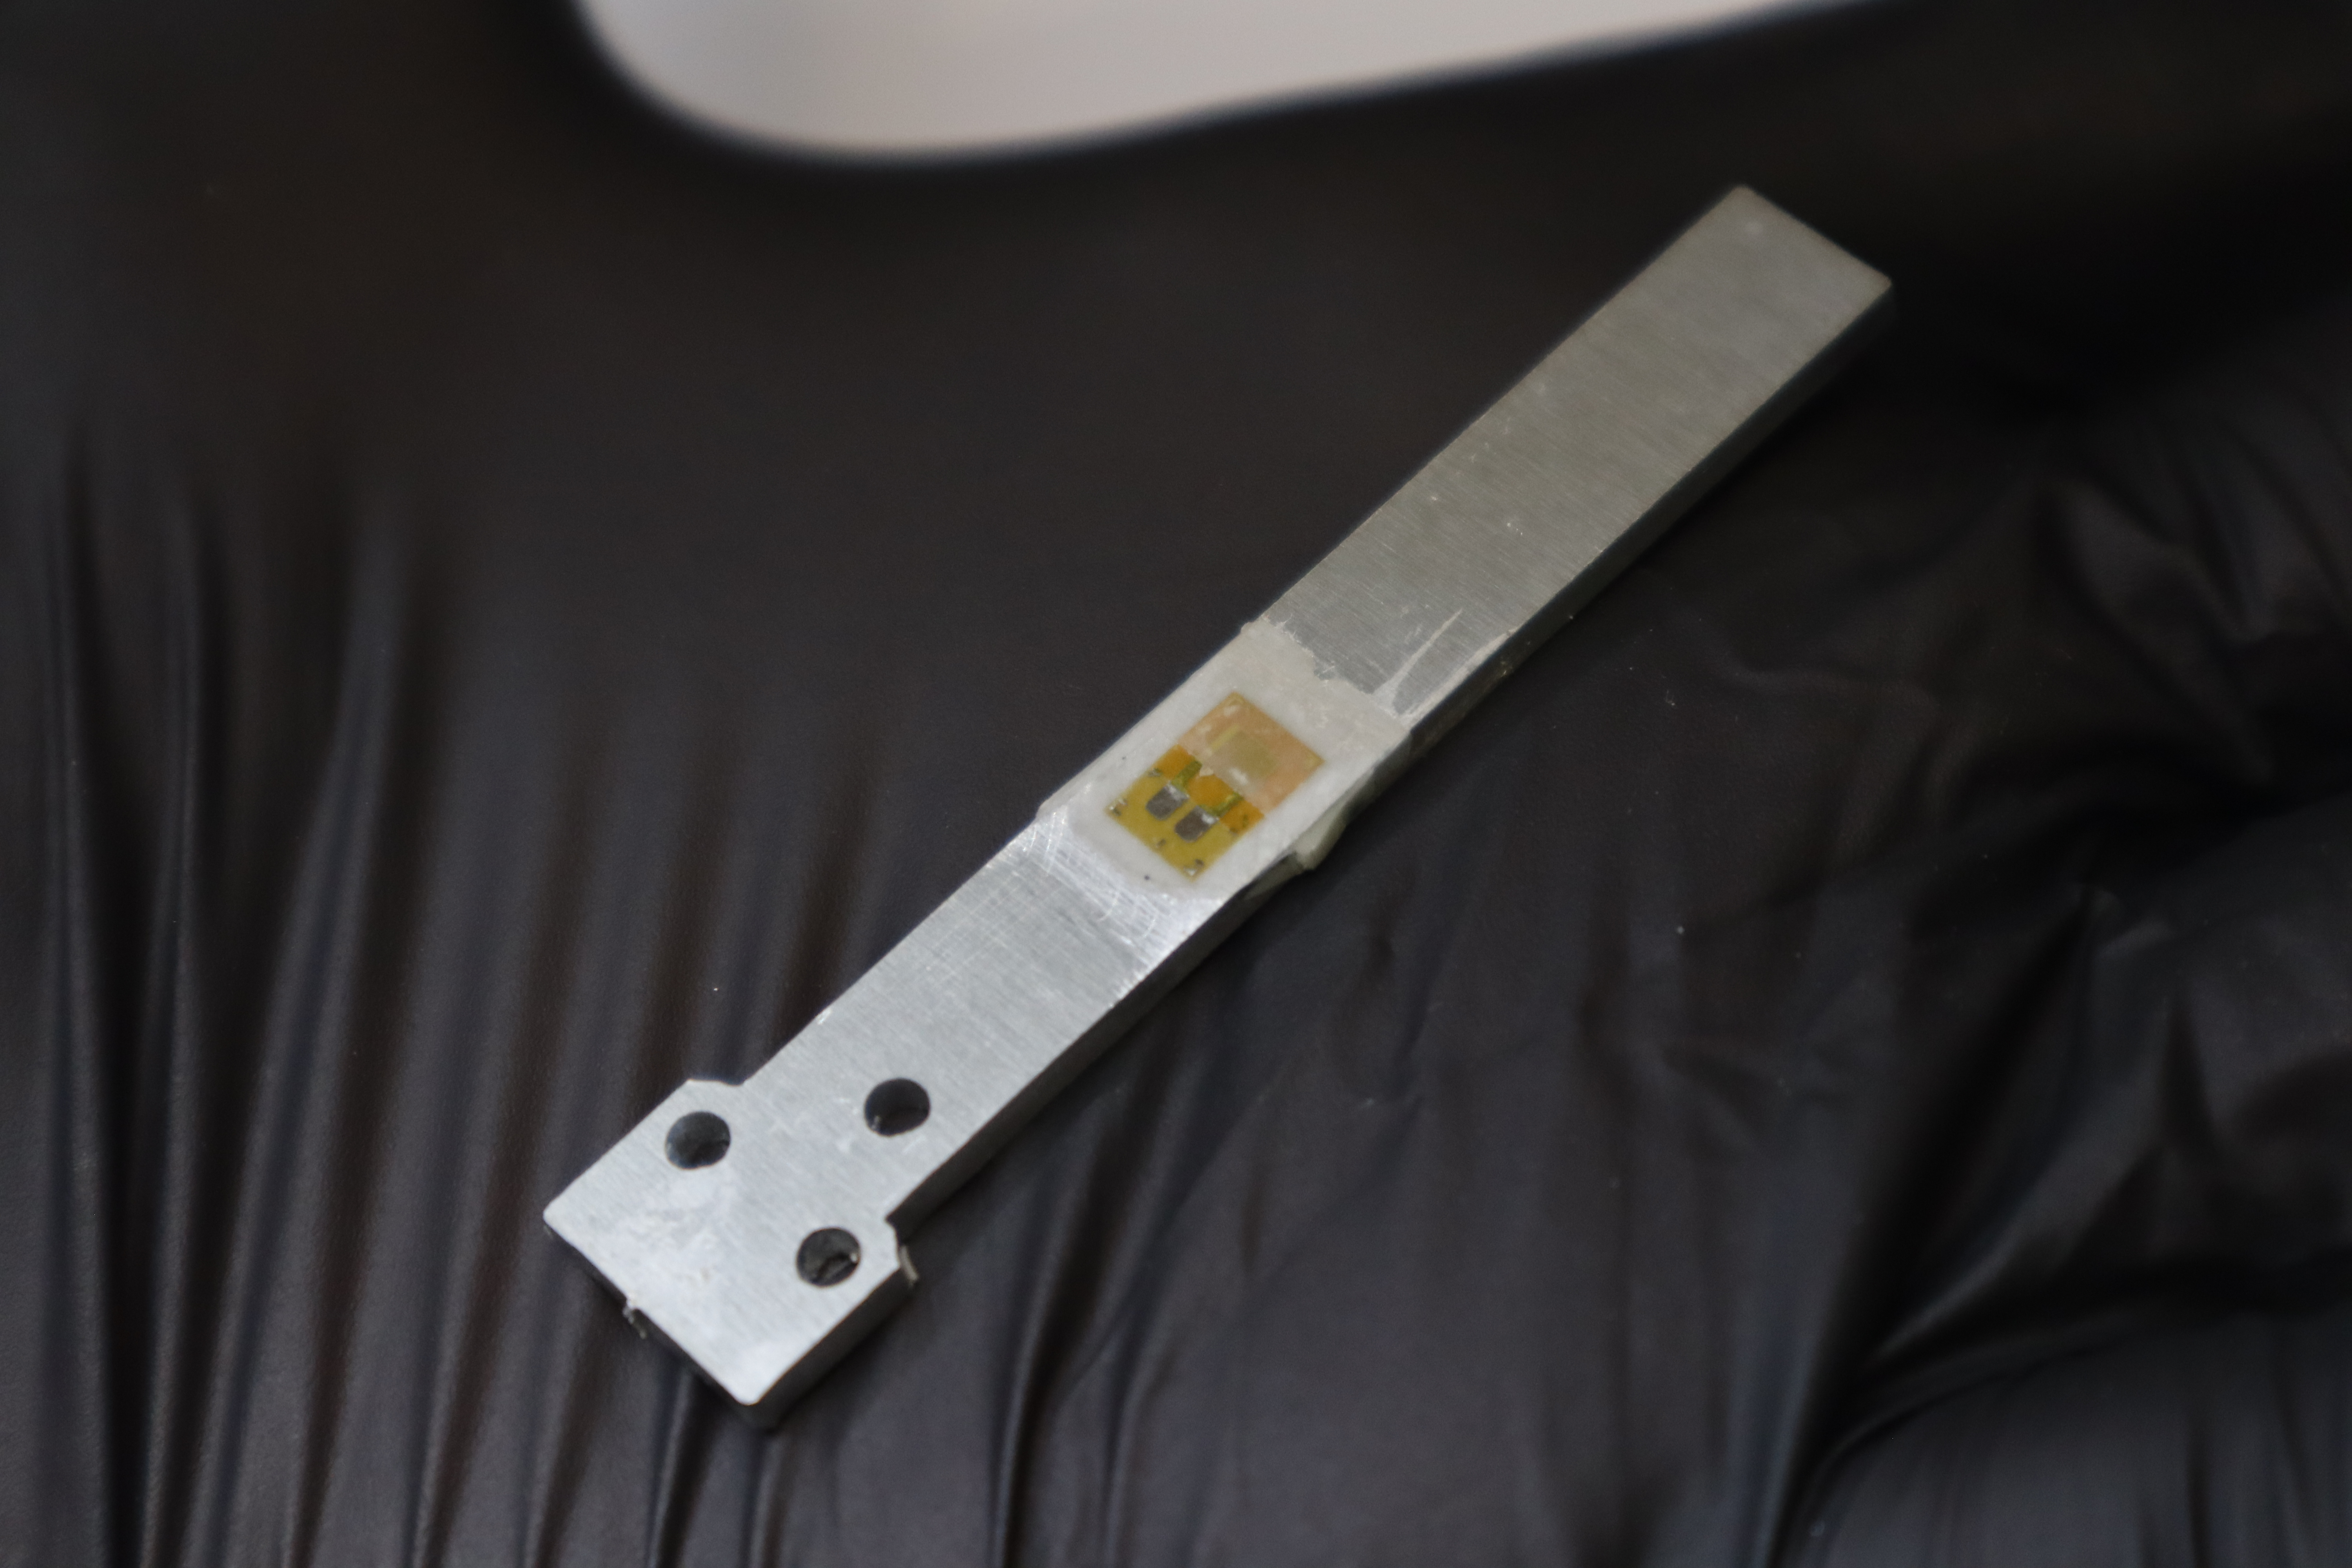
6.1 Detailed Installation Protocol
Extracted and refined from the full 11-page strain-gauge installation manual (Appendix B of the report):
| Step | Detailed Procedure |
|---|---|
| Surface Preparation | Sequential sanding (400 → 800 → 1200-grit), thorough degreasing with isopropyl alcohol to ensure adhesion. |
| Adhesive Mixing | Precisely mixed M-Bond 200 adhesive (resin : catalyst ratio 100 : 10 wt %) immediately prior to use. |
| Gauge Placement | Gauges precisely aligned (±0.2 mm), uniform pressure application (80 kPa), inspected visually post-placement. |
| Curing Protocol | Initial cure at 50 °C for 3 minutes, followed by 25 °C ambient stabilization for 1 hour. |
| Quality Assurance | Bridge resistance validation (349 ± 1 Ω), insulation check (> 5 GΩ) ensuring electrical reliability. |
7 · Experimental Results & Validation
7.1 Summary of Key Findings
Experimental validations demonstrate that the analytical crossed-strip theory accurately predicts hinge deformation and stress within acceptable engineering tolerances.
| Test Case | Model Angle (°) | Measured Angle (°) | Centre Drift (mm) | Strain Error (%) |
|---|---|---|---|---|
| 15° Bend | 14.8 | 15.9 | 1.4 (model) vs 1.6 (exp.) | < 6% |
| 30° Bend | 30.3 | 32.1 | 3.1 (model) vs 3.4 (exp.) | < 5% |
7.2 Detailed Experimental Analysis — 15° Bend
The experimental results for the 15° bend condition show close alignment between theoretical predictions and measurements:
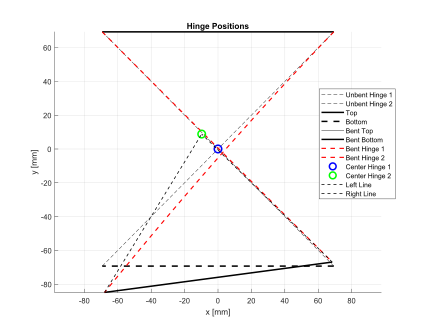

15° bend: Model prediction vs experimental validation
Quantitative Results (15° Bend):
-
Centre-of-rotation drift: Predicted: 1.4 mm Experimental (CV): 1.6 mm (error: ~0.2 mm) - Peak Strain Measurement: Δε = 156 µε experimentally measured, closely matching the model (within 6%).
- Computer Vision Accuracy: Angular deviation 1.1°, RMS fit error 0.33 mm, verifying model reliability.
7.3 Detailed Experimental Analysis — 30° Bend
The higher deformation condition (30°) similarly exhibited strong correlation with analytical predictions:


30° bend: Model prediction vs experimental validation
Quantitative Results (30° Bend):
-
Centre-of-rotation drift: Predicted: 3.1 mm Experimental (CV): 3.4 mm (error: ~0.3 mm) - Peak Strain Measurement: Δε = 307 µε experimentally measured, closely aligned to analytical values (within 5%).
- Computer Vision Accuracy: Angular deviation 1.8°, RMS fit error 0.37 mm, further reinforcing model accuracy.
7.4 Model Discrepancies & Uncertainty Analysis
Despite high correlation, small discrepancies arose between experimental data and analytical predictions:
Observed Differences in Curvature Coefficients:
- 15° Test: MATLAB model coefficient significantly differs in magnitude from the CV-fitted polynomial due to differing units (mm vs pixels) and idealized boundary conditions.
- 30° Test: Similar discrepancies observed, highlighting real-world complexity vs simplified analytical assumptions.
Primary Sources of Uncertainty:
- Perspective Distortion: Slight (<2%) geometric distortion in captured images affecting edge-detection accuracy.
- Material Property Variation: Uncertainties in spring-steel’s Young’s modulus (~5%) impacting stiffness calculations.
- Manufacturing Tolerances: Thickness deviations in spring-steel strips (±0.05 mm) altering stiffness predictions.
- Boundary Conditions: Idealized analytical boundary conditions differ from actual clamping conditions, leading to minor drift and angular differences.
These findings underscore the analytical model’s utility as a reliable predictive tool, with minor deviations stemming from realistic manufacturing and testing constraints.
8 · Limitations & Challenges
Throughout this research, several practical and theoretical challenges limited the scope and precision of the outcomes. Understanding these limitations helps contextualize the results and guides future improvements.
8.1 Experimental Limitations
Partial Robot Base Integration:
- Full integration into the Gazebo digital twin faced technical challenges, preventing comprehensive robot-level simulation and evaluation within the project timeframe.
- Time constraints restricted the execution of planned real-world testing with the Franka Panda robot, limiting experimental validation primarily to bench-top tests.
- A steel adapter plate was manufactured and partially tested, but complete dynamic loading and full validation in realistic robotic scenarios remain outstanding.
Limited Validation Scope:
- Experimental tests focused solely on static loading conditions (specifically at 15° and 30° bends), leaving dynamic properties such as frequency response, hysteresis, and damping uncharacterized.
- Due to time and resource limitations, fatigue performance and long-term reliability of the flexure hinges under repeated cyclic loading could not be assessed.
8.2 Analytical Model Assumptions
Simplifying Assumptions & Idealizations:
- Material Homogeneity: The analytical model assumes perfect uniformity in spring-steel properties, ignoring realistic variations due to grain structures and minor imperfections inherent in manufactured metals.
- Ideal Boundary Conditions: Real-world clamping interfaces introduce compliance, stress concentrations, and frictional effects, whereas the analytical model assumes rigid and idealized boundary conditions.
- Linear Elastic Behavior: The theory adopted for the crossed-strip flexure pivot assumes linear elasticity, neglecting potential nonlinear stress-strain responses at large deflections or high strains.
- Quasi-static Assumptions: Gravity and inertial effects, although minimal in the tested conditions, are assumed negligible in the analysis, which may impact predictions during faster, dynamic motions.
8.3 Manufacturing Constraints
Prototype Manufacturing Limitations:
- PLA Clamp Material: Proof-of-concept prototypes utilized 3D-printed PLA clamps, suitable for initial validation but inadequate for long-term or high-load conditions due to low stiffness and potential creep under sustained load.
- Manual Adhesive Application: Hand-applied strain gauge adhesive introduces variability in gauge placement and bond strength, potentially affecting strain measurement repeatability and accuracy.
- Material Thickness Constraints: Limited availability of tooling restricted the spring-steel strip thickness to 0.5 mm; exploring alternative thicknesses and materials could improve flexure performance and durability.
9 · Integration with FTE-Omega-160 Sensor
For practical evaluation and validation of the flexure hinge stage, we designed a custom precision-machined steel adapter plate to interface seamlessly between the hinge assembly and the FTE-Omega-160-IP60 SI-1000-120 force-torque sensor.
Integration & Assembly Steps:
-
Robotic Interface: The crossed-flexure hinge assembly attaches directly to the wrist of the Franka Panda robot arm, with PLA clamps planned to be upgraded to anodized aluminum clamps for enhanced rigidity in realistic robotic testing scenarios.
-
Sensor Attachment: The FTE-Omega-160 sensor mounts securely beneath the flexure hinge via flush-mounted M6 screws, ensuring precise alignment and parallelism within ±0.02 mm tolerance for accurate force and moment measurement.
-
Calibration Strategy: A structured six-point planar loading jig is proposed for systematic calibration, including both strain-gauge data and computer-vision deformation compensation. Calibration data will be exported in CSV format for direct integration into robot control algorithms and impedance controllers.

Final Flexure Hinge
By diverting large tilting moments away from the sensor body, the flexure hinge effectively maintains the sensor’s sub-newton force resolution, even under significant moment loads representative of realistic robotic manipulation tasks.
10 · Future Work & Development Roadmap
The outcomes of this research lay the groundwork for continued development and broader exploration of flexure hinge applications in robotic sensing. This roadmap delineates clear paths forward to refine, validate, and scale this promising concept.
10.1 Immediate Next Steps (Short-Term Goals)
-
Complete Robotic Integration & Validation: Finalize the steel adapter plate integration with the Franka Panda arm, validating the full system under realistic 6-DoF loading scenarios and dynamic conditions representative of intended robot applications.
-
Dynamic Load Characterization: Perform rigorous sinusoidal bending experiments at frequencies up to 5 Hz, measuring key dynamic response parameters such as hysteresis, structural damping, resonant frequencies, and amplitude-dependent stiffness variations.
-
Material and Clamp Optimization: Replace prototype PLA clamps with precision-machined 7075-T6 aluminum clamps, increasing preload torque to 25 Nm, thereby enhancing rigidity, repeatability, and long-term stability for production readiness.
10.2 Advanced Research Directions (Medium-Term Goals)
-
Comprehensive 6-DoF Calibration: Implement a planar, multi-axis loading rig to systematically develop a full 6-DoF calibration matrix (force/moment Jacobian). Further refine calibration accuracy through advanced polynomial and second-order regression models.
-
Finite Element Validation & Optimization: Conduct a comprehensive finite-element analysis (FEA) in ANSYS Mechanical, performing detailed mesh convergence studies down to 0.1 mm elements. Correlate simulated stress and strain contours directly with experimentally obtained strain-gauge data.
-
Fatigue & Durability Assessment: Initiate systematic fatigue testing involving at least $10^6$ loading cycles at 80% of maximum rated moment. Inspect leaf spring edges and gauge bonding interfaces for signs of fatigue-induced micro-cracks or degradation.
10.3 Scaling & Production (Long-Term Goals)
-
Multi-Stage Flexure Design: Investigate and prototype cascaded flexure hinge assemblies (coarse and fine stages), enabling sensor moment capacities approaching 500 Nm while preserving sub-newton force measurement accuracy.
-
Open Hardware Initiative: Publicly share STEP files, comprehensive BOMs, calibration procedures, computer-vision scripts, and the 11-page strain-gauge installation manual through GitHub under MIT and CERN Open Hardware Licenses, encouraging collaborative improvement and adoption.
-
Robotic Controller Integration: Directly feed calibrated force-torque signals into the Franka Panda’s Cartesian impedance control framework, systematically evaluating closed-loop system stability, robustness, and performance in real-time high-moment robotic manipulation tasks.
Research conducted at TUM-MIRMI (2024) • Supervisor: Mehmet Can Yıldırım • Chair: Prof. Sami Haddadin